The Talivity Talent Market Index

    Your monthly labor market index—built for talent leaders

    Register for Our Next Briefing

    Watch the Talent Market Index for August 2026

    Top 3 Things Talent Leaders Need to Know

    Market analyst's callout board for August 2026

    Three Reports In a Row, Three Downward Revisions

    Payrolls fell by 23,000 in July. May was revised from +129K to +63K, June from +57K to +20K, 103K combined. Three straight months of overstated numbers means the market’s been cooling longer than the real-time data showed.
    The Unemployment Rate Is Masking a Bigger Drop

    Unemployment fell to 4.1%, but for the wrong reason: participation dropped to 61.4%, the lowest since February 2021. Prime-age workers (25-54) are the group to watch, retirement doesn’t explain a drop there, and it’s the clearest signal of real discouragement.

    Rising Costs, Uneven Pressure

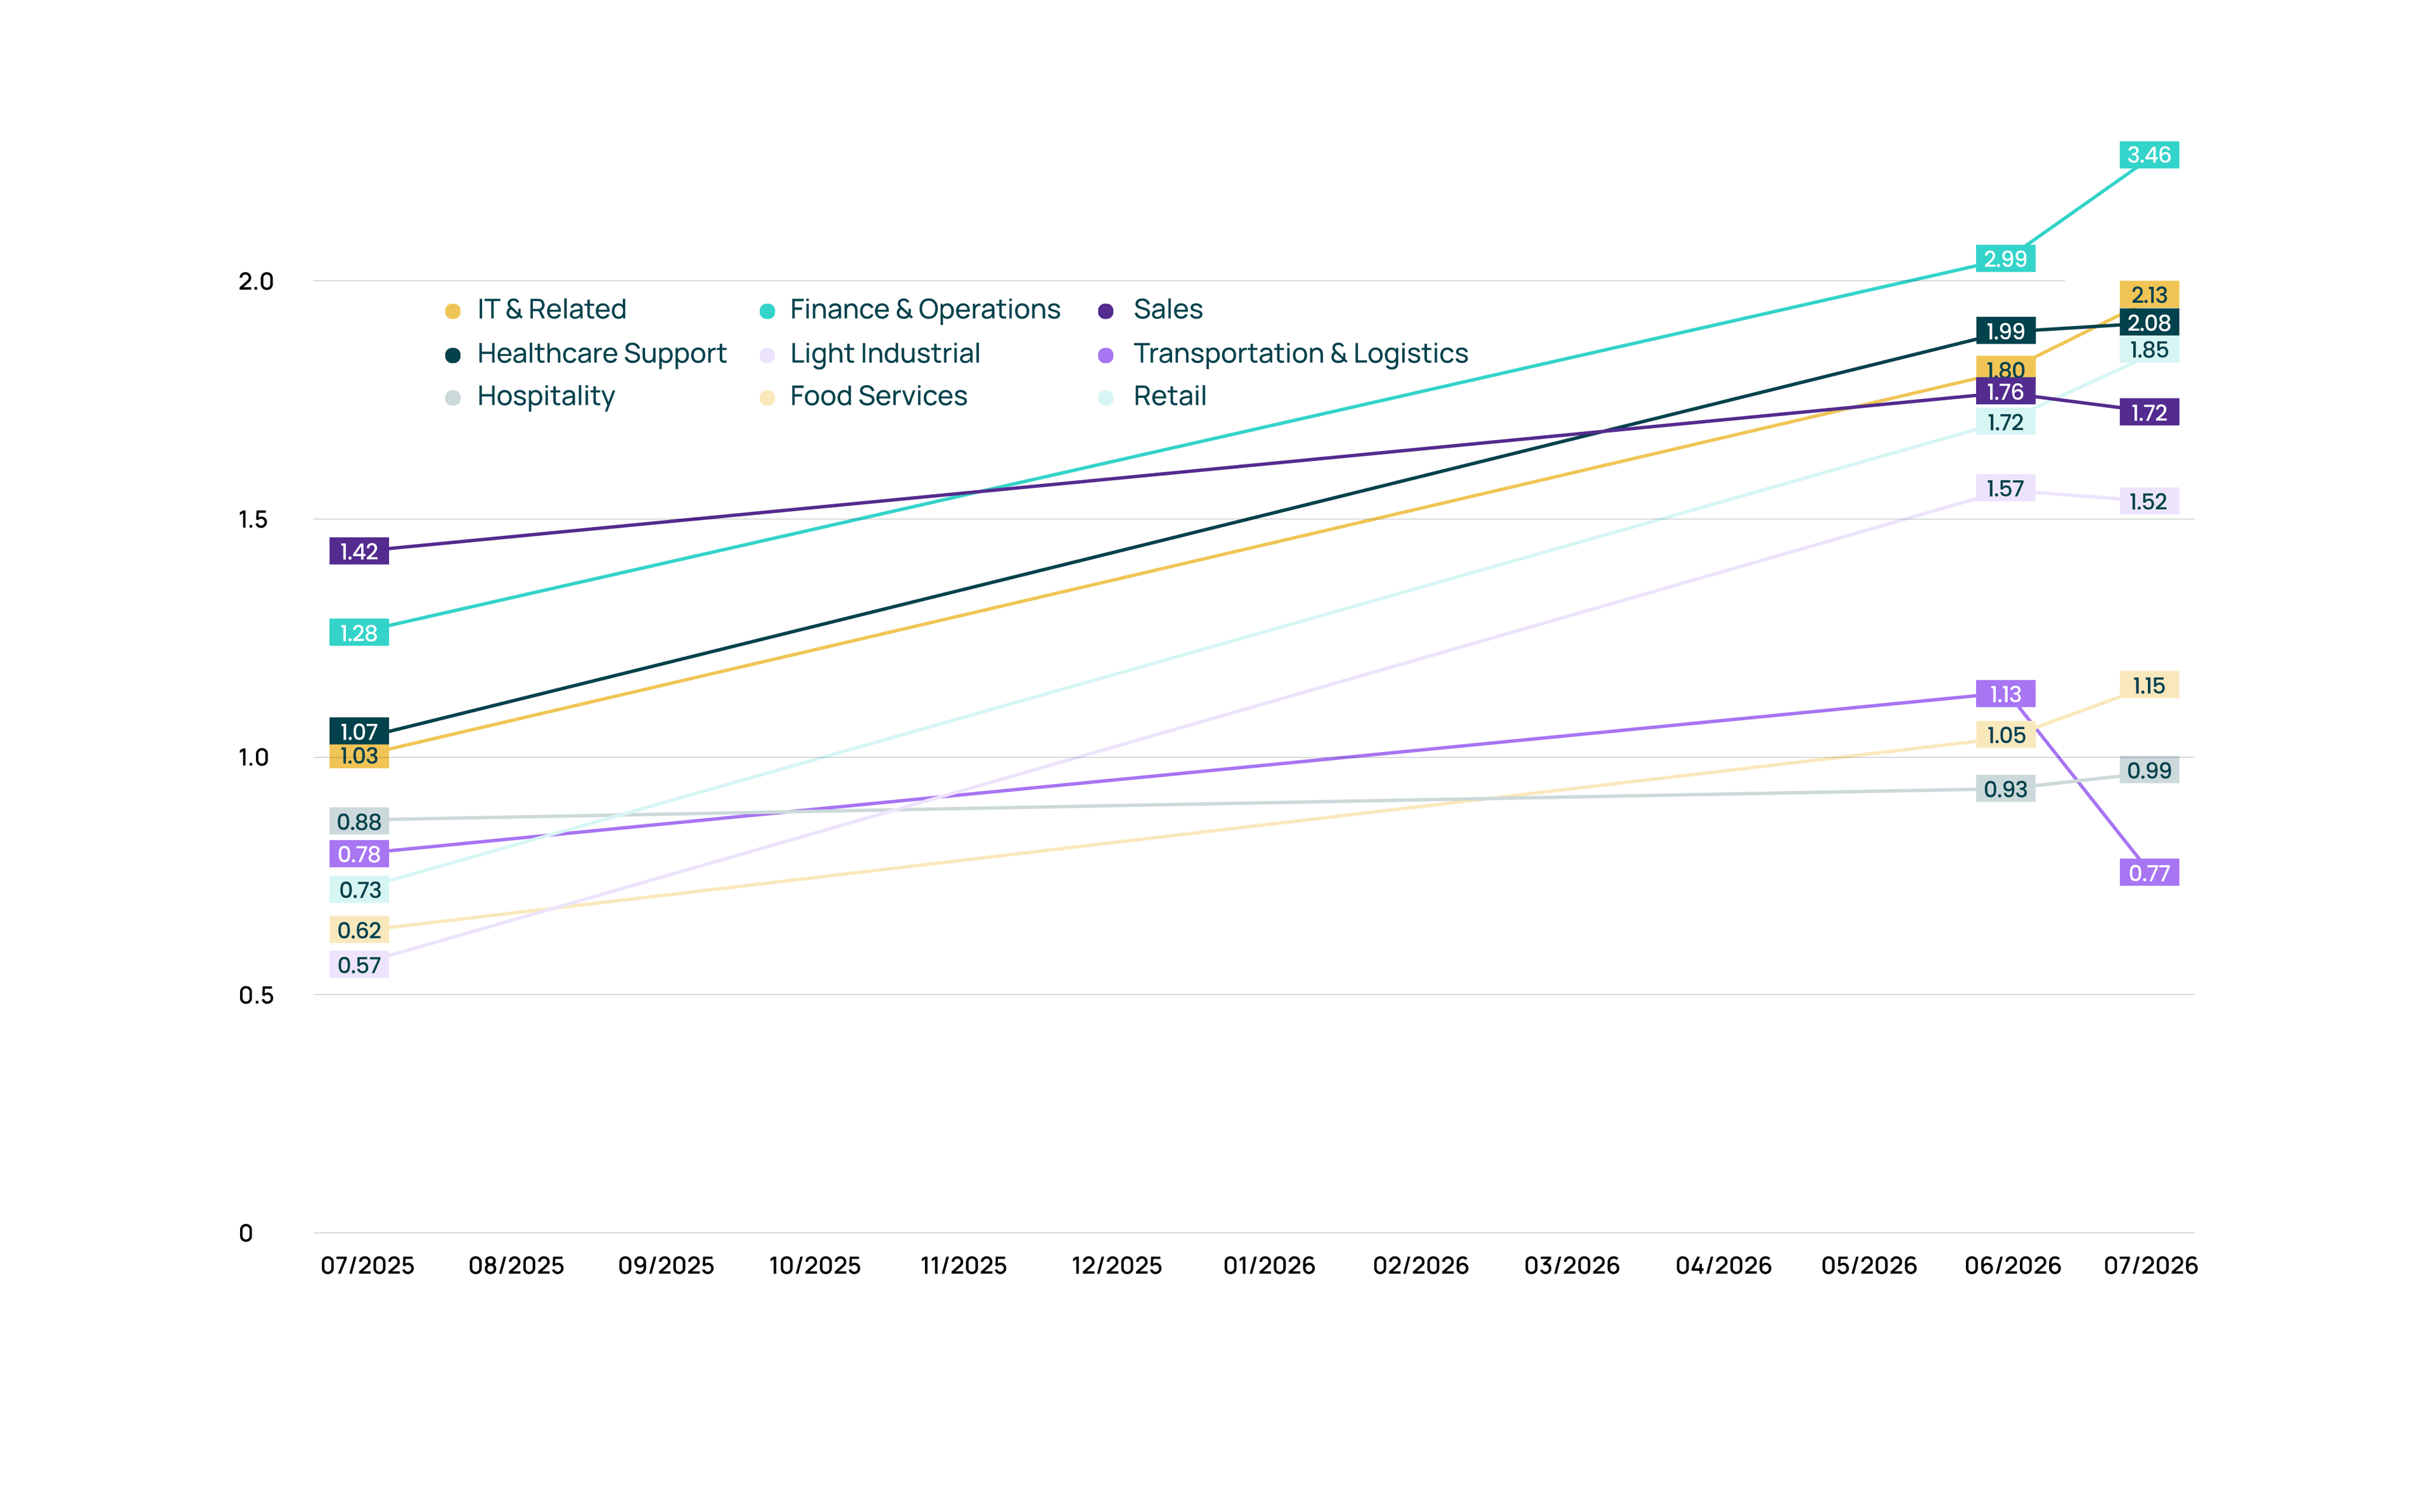
    6 of 9 segments rose in July, but the gains aren’t even. Finance & Operations leads at 3.46, up 170% year over year. IT & Related climbed 106.8% YoY. Transportation & Logistics dropped 31.87% month over month, the sharpest pullback in the index

    Talent Market Index™

    The Talivity Talent Market Index (TMI) offers a fresh perspective on talent supply and demand dynamics across industries. It tracks the fluctuating prices employers pay to attract talent through paid advertising across diverse media channels.

    Talent Market Index by Job Family

    Current month performance indicators for August 2026

    View Data As Chart

    Top Performers (TMI)

    Finance & Operations
    TMI: 3.46
    +15.72%
    MoM
    IT & Related
    TMI: 2.13
    +18.33%
    MoM
    Healthcare
    TMI: 2.08
    +4.00%
    MoM

    Other Sectors

    Retail
    +7.56%MoM
    TMI: 1.85
    Sales
    -2.27%MoM
    TMI: 1.72
    Light Industrial
    -3.18%MoM
    TMI: 1.52
    Food Services
    +9.52%MoM
    TMI: 1.15
    Hospitality
    +6.45%MoM
    TMI: 0.99
    Transportation & Logistics
    -31.86%MoM
    TMI: 0.77

    Key Findings - August 2026

    Market Leaders

    Finance & Operations is the most expensive segment at 3.46, up nearly 16% in July, even as financial activities lost 14,000 jobs and sit 121,000 below their May 2025 peak. IT & Related rose more than 18% despite little overall employment change in the information sector, pointing to concentrated investment in AI, data, cybersecurity, and technical infrastructure roles. Healthcare stays elevated, up another 4.5% even as job growth came in below its recent average.

    Biggest MoM Movers

    Transportation & Logistics fell almost 32% this month, nearly reversing last month's 31% increase and dropping back below baseline — a swing the script flags as volatility rather than a settled trend. IT & Related rose more than 18% month over month, and Finance & Operations rose nearly 16%, both continuing to climb.

    YoY Leaders

    Finance & Operations leads at 170% YoY, followed by Light Industrial at nearly 167% and Retail at more than 153%. IT & Related follows close behind at nearly 107% YoY — all four segments getting more expensive even as underlying job counts shrink or stay flat.

    Macro Context

    July payrolls fell by 23,000, below the prior year's 34,000-per-month average, extending three straight months of downward revisions (May cut from 129K to 63K, June from 57K to 20K — 103,000 jobs removed). Unemployment fell to 4.1%, but participation dropped to 61.4%, the lowest since February 2021, with prime-age workers pulling back too. Six of nine segments got more expensive in July even as hiring volume falls, because the TMI measures the cost of capturing attention, not job creation.

    Industry Breakdown & Analysis

    Detailed insights by sector for August 2026

    TMI: 3.46
    Finance & Operations
    +15.72%MoM
    |
    +170.31%YoY
    TMI: 2.13
    IT & Related
    +18.33%MoM
    |
    +106.80%YoY
    TMI: 2.08
    Healthcare
    +4.00%MoM
    |
    +94.39%YoY
    TMI: 1.85
    Retail
    +7.56%MoM
    |
    +153.42%YoY
    TMI: 1.72
    Sales
    -2.27%MoM
    |
    +21.13%YoY
    TMI: 1.52
    Light Industrial
    -3.18%MoM
    |
    +166.67%YoY
    TMI: 1.15
    Food Services
    +9.52%MoM
    |
    +85.48%YoY
    TMI: 0.99
    Hospitality
    +6.45%MoM
    |
    +12.50%YoY
    TMI: 0.77
    Transportation & Logistics
    -31.86%MoM
    |
    -1.28%YoY

    Stay Informed

    Subscribe to our insights and stay ahead of the curve with expert perspectives on talent acquisition, employer branding, and workforce strategies.