The Talivity Talent Market Index

    Your monthly labor market index—built for talent leaders

    Register for Our Next Briefing

    Watch the Talent Market Index for June 2026

    Top 3 Things Talent Leaders Need to Know

    Market analyst's callout board for June 2026

    Labor Market Surprises, But the Split Screen Widens

    May came in at 172,000 jobs added — nearly double what economists expected. And the instinct is to read that as: labor market is strong, competition is back, costs are going up. But that's not the whole picture. Because when you look at where those jobs landed — Leisure & Hospitality at nearly 5x its 12-month average, local Government rebuilding administrative capacity, Healthcare continuing its steady climb — what you're really seeing is a market that's strong in very specific pockets. And then look at the other side of the ledger. Financial Activities shed 22,000 jobs in May and is down 107,000 since its peak a year ago. Manufacturing of nondurable goods lost another 10,000. Private education services dropped 7,000.
    The Real Strength Signal Isn't the Unemployment Rate

    Prime-age employment hit 80.8% — near a cyclical peak and a cleaner read on labor market health than the headline rate. But quits declined, hiring fell, and openings surged — a disconnect that keeps consumers cautious even when the numbers look strong.

    Sticky Costs, Choppy Headlines

    7 of 9 segments remain above baseline. JOLTS showed openings surge to 7.6 million in April — a near two-year high. And yet quits declined. Hiring fell. Workers are not behaving like the market suddenly opened up for them. And that disconnect is actually the most important thing on this slide for anyone in talent acquisition — because your candidates are living in that gap. They're seeing job postings. They're not feeling opportunity. And that changes everything about how you show up in the market.

    Talent Market Index™

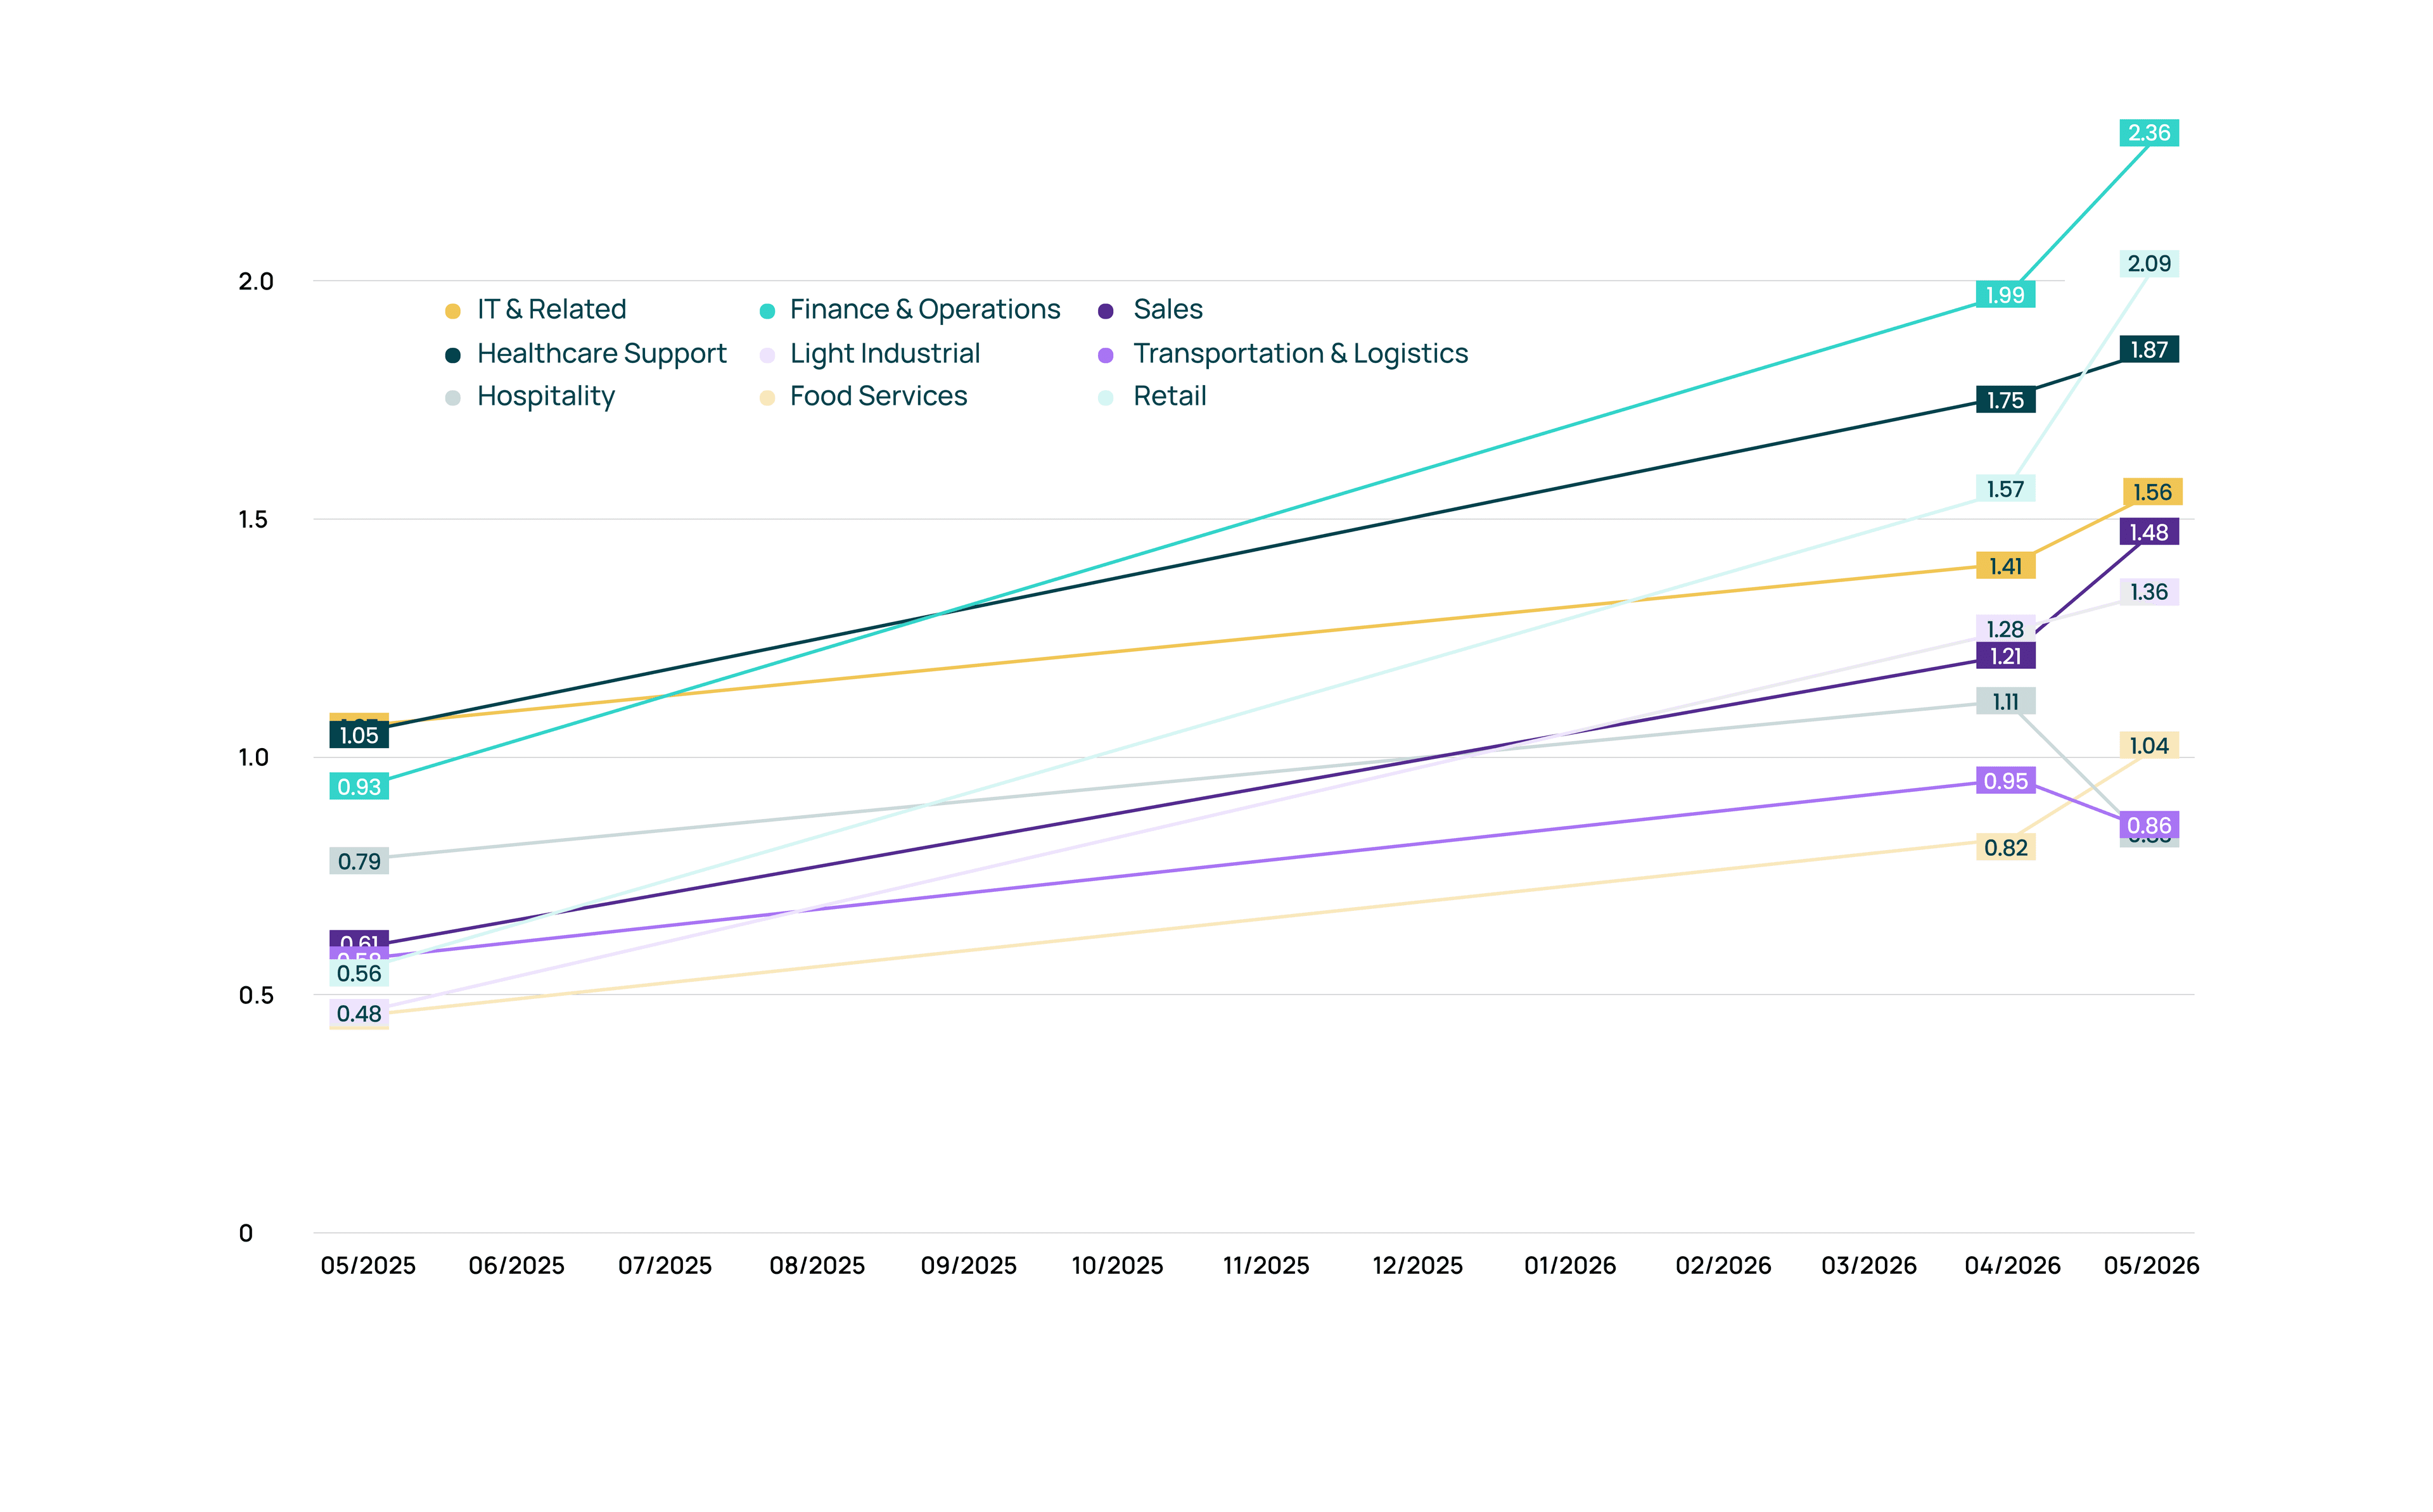
    The Talivity Talent Market Index (TMI) offers a fresh perspective on talent supply and demand dynamics across industries. It tracks the fluctuating prices employers pay to attract talent through paid advertising across diverse media channels.

    Talent Market Index by Job Family

    Current month performance indicators for June 2026

    View Data As Chart

    Top Performers (TMI)

    Finance & Operations
    TMI: 2.36
    +18.59%
    MoM
    Retail
    TMI: 2.09
    +33.12%
    MoM
    Healthcare
    TMI: 1.87
    +6.86%
    MoM

    Other Sectors

    IT & Related
    +10.64%MoM
    TMI: 1.56
    Sales
    +22.31%MoM
    TMI: 1.48
    Light Industrial
    +6.25%MoM
    TMI: 1.36
    Food Services
    +26.83%MoM
    TMI: 1.04
    Transportation & Logistics
    -9.47%MoM
    TMI: 0.86
    Hospitality
    -25.23%MoM
    TMI: 0.83

    Key Findings - June 2026

    Market Leaders

    Finance & Operations and Healthcare remain the most competitive segments in the Index. Finance & Operations is up nearly 19% month over month and 154% year over year, despite falling job postings — pointing to a shift toward higher-value analytical and advisory roles rather than hiring volume. Healthcare sits above a 2.0 TMI score, up 6.85% month over month and 78% year over year, driven by workforce shortages, an aging population, and expanding care settings.

    Across both, employers are paying a premium for experienced talent where supply is tight and business impact is high.

    Biggest MoM Movers

    Retail was the standout mover this period, up 33.12% month over month with cost pressures continuing to climb even after already elevated levels. Transportation & Logistics moved in the opposite direction, cooling to -9.47% month over month while still elevated at 48% year over year. Food Services also continued to rise, up near 27% month over month.

    YoY Leaders

    Sales is up more than 140% year over year, reflecting continued investment in revenue-generating talent even as broader hiring slows. Retail is up more than 270% year over year, pointing to sustained wage pressure and competition for frontline workers. Food Services is also up sharply, rising 126% year over year. Light Industrial rose 183.33% year over year, benefiting from improved labor supply but still commanding higher pay than historically typical.

    Macro Context

    The key takeaway is that while hiring activity may be slowing in certain areas, talent acquisition leaders shouldn't confuse lower hiring volume with less expensive hiring conditions. In many cases, the opposite is true — organizations are hiring fewer people, but for more specialized, higher-value roles.

    That means competition remains intense, compensation remains elevated, and employers still need a strong recruiting and employer brand strategy to compete. So while the economy may be cooling in some areas, the talent market is still demanding a premium for the skills organizations need most.

    Industry Breakdown & Analysis

    Detailed insights by sector for June 2026

    TMI: 2.36
    Finance & Operations
    +18.59%MoM
    |
    +153.76%YoY
    TMI: 2.09
    Retail
    +33.12%MoM
    |
    +273.21%YoY
    TMI: 1.87
    Healthcare
    +6.86%MoM
    |
    +78.10%YoY
    TMI: 1.56
    IT & Related
    +10.64%MoM
    |
    +45.79%YoY
    TMI: 1.48
    Sales
    +22.31%MoM
    |
    +142.62%YoY
    TMI: 1.36
    Light Industrial
    +6.25%MoM
    |
    +183.33%YoY
    TMI: 1.04
    Food Services
    +26.83%MoM
    |
    +126.09%YoY
    TMI: 0.86
    Transportation & Logistics
    -9.47%MoM
    |
    +48.28%YoY
    TMI: 0.83
    Hospitality
    -25.23%MoM
    |
    +5.06%YoY

    Stay Informed

    Subscribe to our insights and stay ahead of the curve with expert perspectives on talent acquisition, employer branding, and workforce strategies.