Two Reports. Two Different Stories.
BLS reported 162,000 new jobs in August, the strongest month of the year. ADP reported just 38,000, the weakest since January. The split confirms that the labor market is not moving in one clear direction.
Your monthly labor market index—built for talent leaders
Register for Our Next BriefingWatch the Talent Market Index for September 2026
Market analyst's callout board for September 2026
BLS reported 162,000 new jobs in August, the strongest month of the year. ADP reported just 38,000, the weakest since January. The split confirms that the labor market is not moving in one clear direction.
Healthcare added just 13,000 jobs in August, well below its 32,000 monthly average over the prior year. This month’s growth was led instead by food services and drinking places (+59,000) and local government education (+42,000).
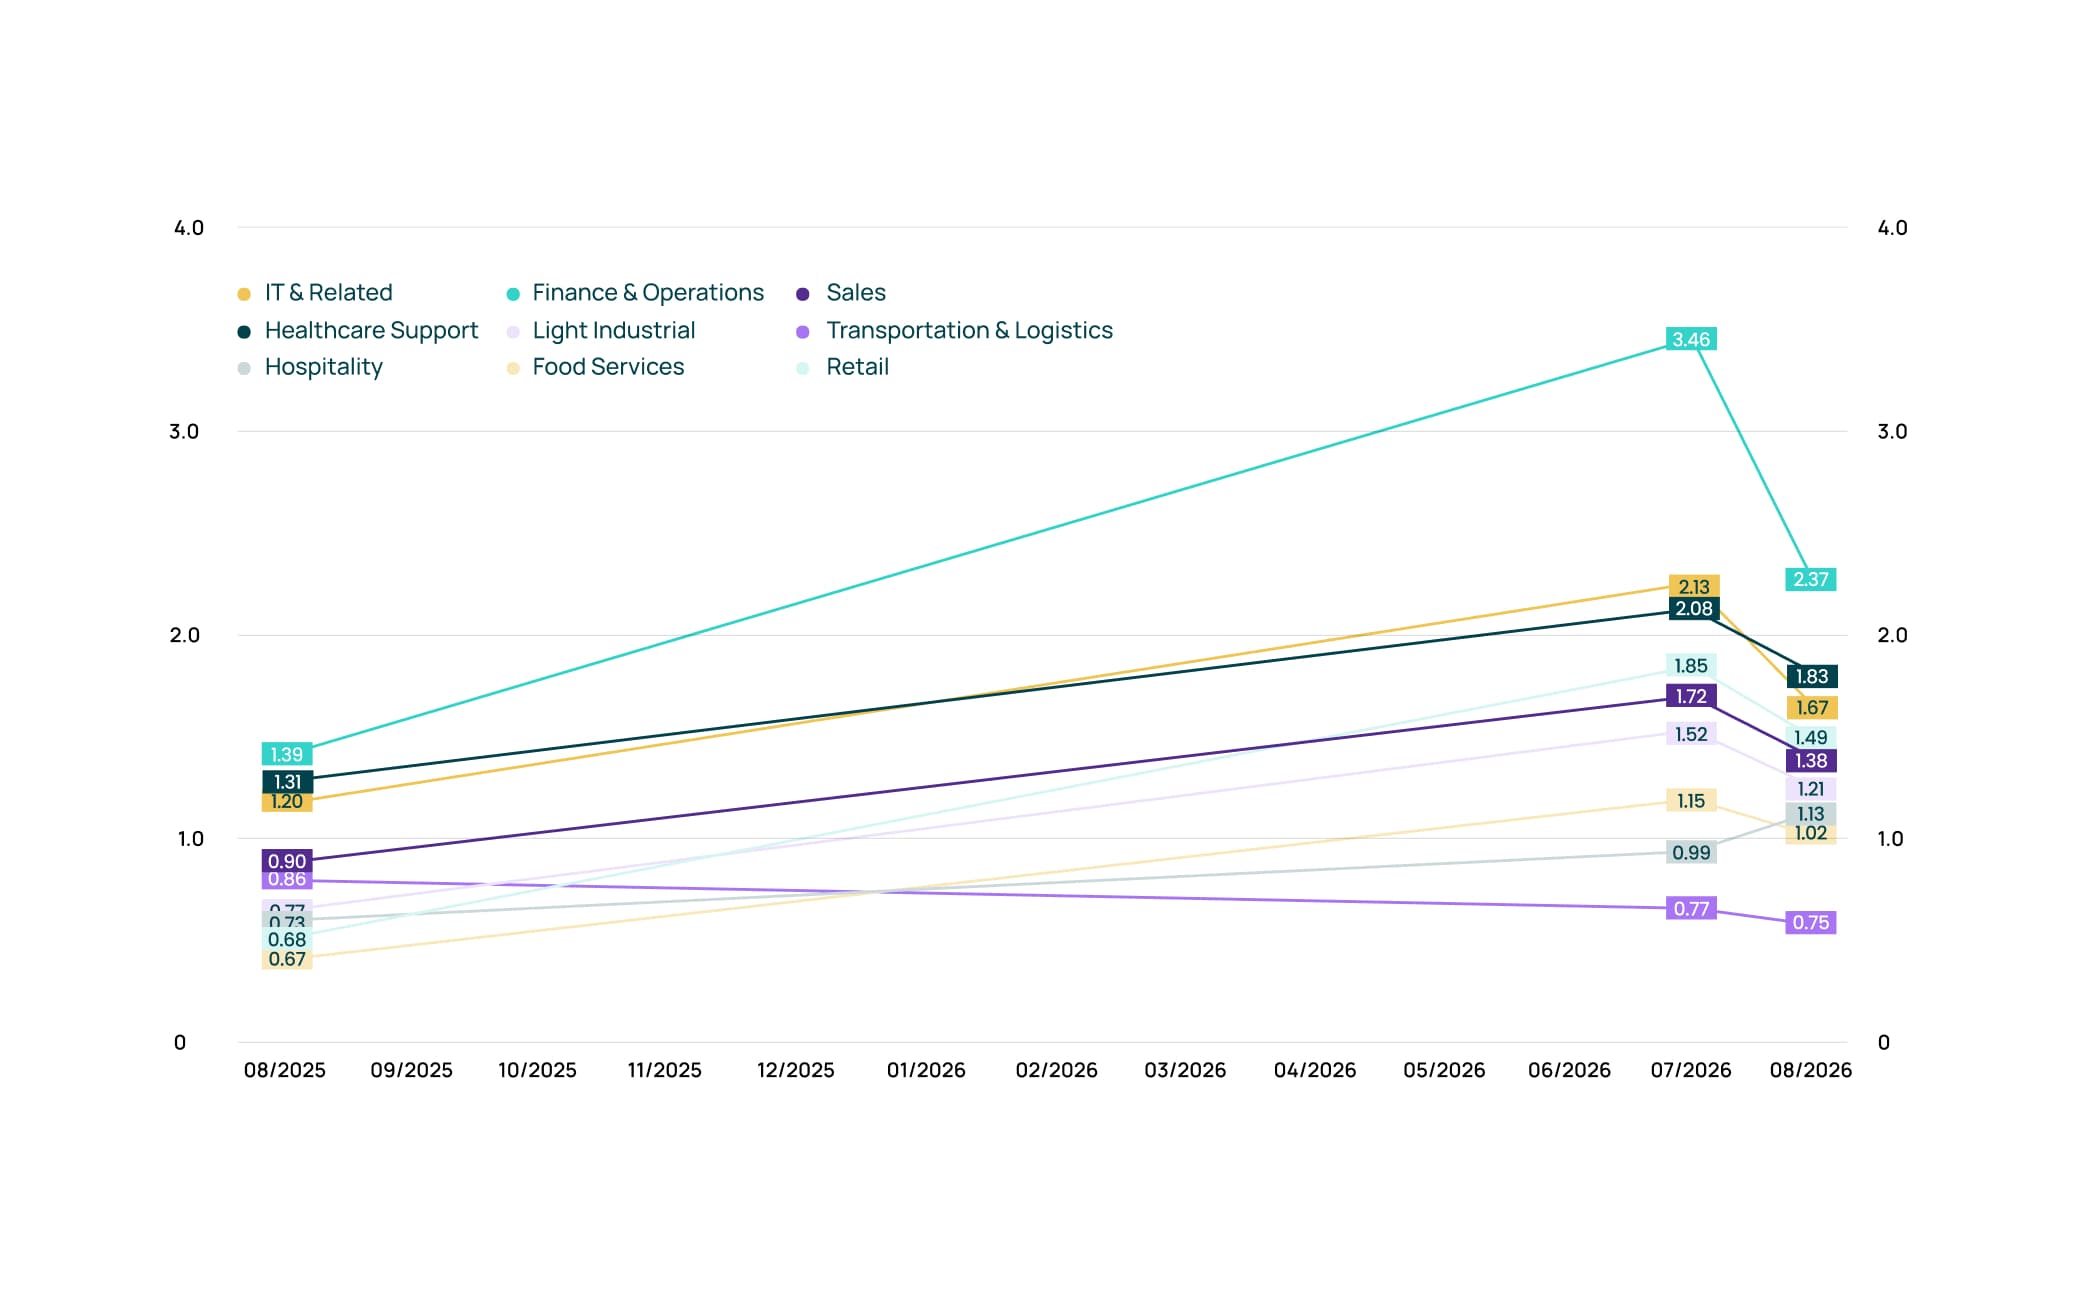
TMI declined across 8 of 9 segments in August, led by Finance & Operations (-31.5%), IT & Related (-21.6%) and Light Industrial (-20.4%). The pressure is beginning to ease, but most categories remain significantly more expensive than they were a year ago.
The Talivity Talent Market Index (TMI) offers a fresh perspective on talent supply and demand dynamics across industries. It tracks the fluctuating prices employers pay to attract talent through paid advertising across diverse media channels.
Current month performance indicators for September 2026
View Data As ChartFinance & Operations leads as the most expensive segment in the Talent Market Index, sitting at more than twice the baseline and 70% above where it was a year ago, even after this month's cooling — which saw the largest monthly decline in the index, falling 31.5% from 3.46 to 2.37. Healthcare holds the second-highest position, with costs still nearly 40% above last year despite a monthly decline.
Transportation & Logistics posted the largest monthly swing, falling almost 32% and dropping below baseline after rising 31% the month prior. Finance & Operations recorded the next-largest move, down 31.5%. IT & Related moved in the opposite direction, up more than 18% for the month.
Light Industrial and Retail lead the index year over year, up nearly 167% and more than 153%, respectively. IT & Related follows closely, up nearly 107% from a year ago, even as overall information-sector employment held roughly flat.
August delivered a real rebound in the labor market, with BLS reporting 162,000 new jobs — the strongest month of the year — alongside upward revisions to June and July, improved participation, and declining underemployment. ADP told a different story, reporting just 38,000 private-sector jobs, its weakest reading since January, with growth unusually concentrated in food services and local government education. Since the report's release, the Fed has raised interest rates a quarter point, adding uncertainty to the outlook ahead. Meanwhile, the Talent Market Index shows eight of nine segments declining in August, though most remain significantly more expensive than a year ago: momentum is improving, but talent pressure remains highly uneven by sector.
Detailed insights by sector for September 2026
Subscribe to our insights and stay ahead of the curve with expert perspectives on talent acquisition, employer branding, and workforce strategies.